What is The Financial Wave Theory?
The Financial wave theory is an elaboration on traditional cyclical analysis as conducted by most market analysts. The method utilizes specific data from the past which we adjust to the present, utilizing a scaling factor, and use the remainder to forecast the future. The method relies on our modified nominal cyclic model to arrive at analogs that we use to predict What is likely to occur next in the global environment. The nominal model of J.M. Hurst is used and further built upon, by the addition of larger cycles, to arrive at our utilized model. The method being described requires a certain level of skill to correctly isolate the price composite into its component price waves. The reason such a method works well is the forgetful nature of mankind — Man continues to repeat previous mistakes made by those before him in a very similar pattern. The more distant we look into the past, provided we use the correct starting point, the more similar the projection we get with future prices. The technical reason behind this is due to the larger similarity in trend, which means similar peak and low translations, while the fundamental reason is being that the similar cyclical circumstance is too distant in the past for current participants to remember the mistakes made back then which naturally increases the correlation with the recent past, the present and the future as well.
How do we arrive at our projections?
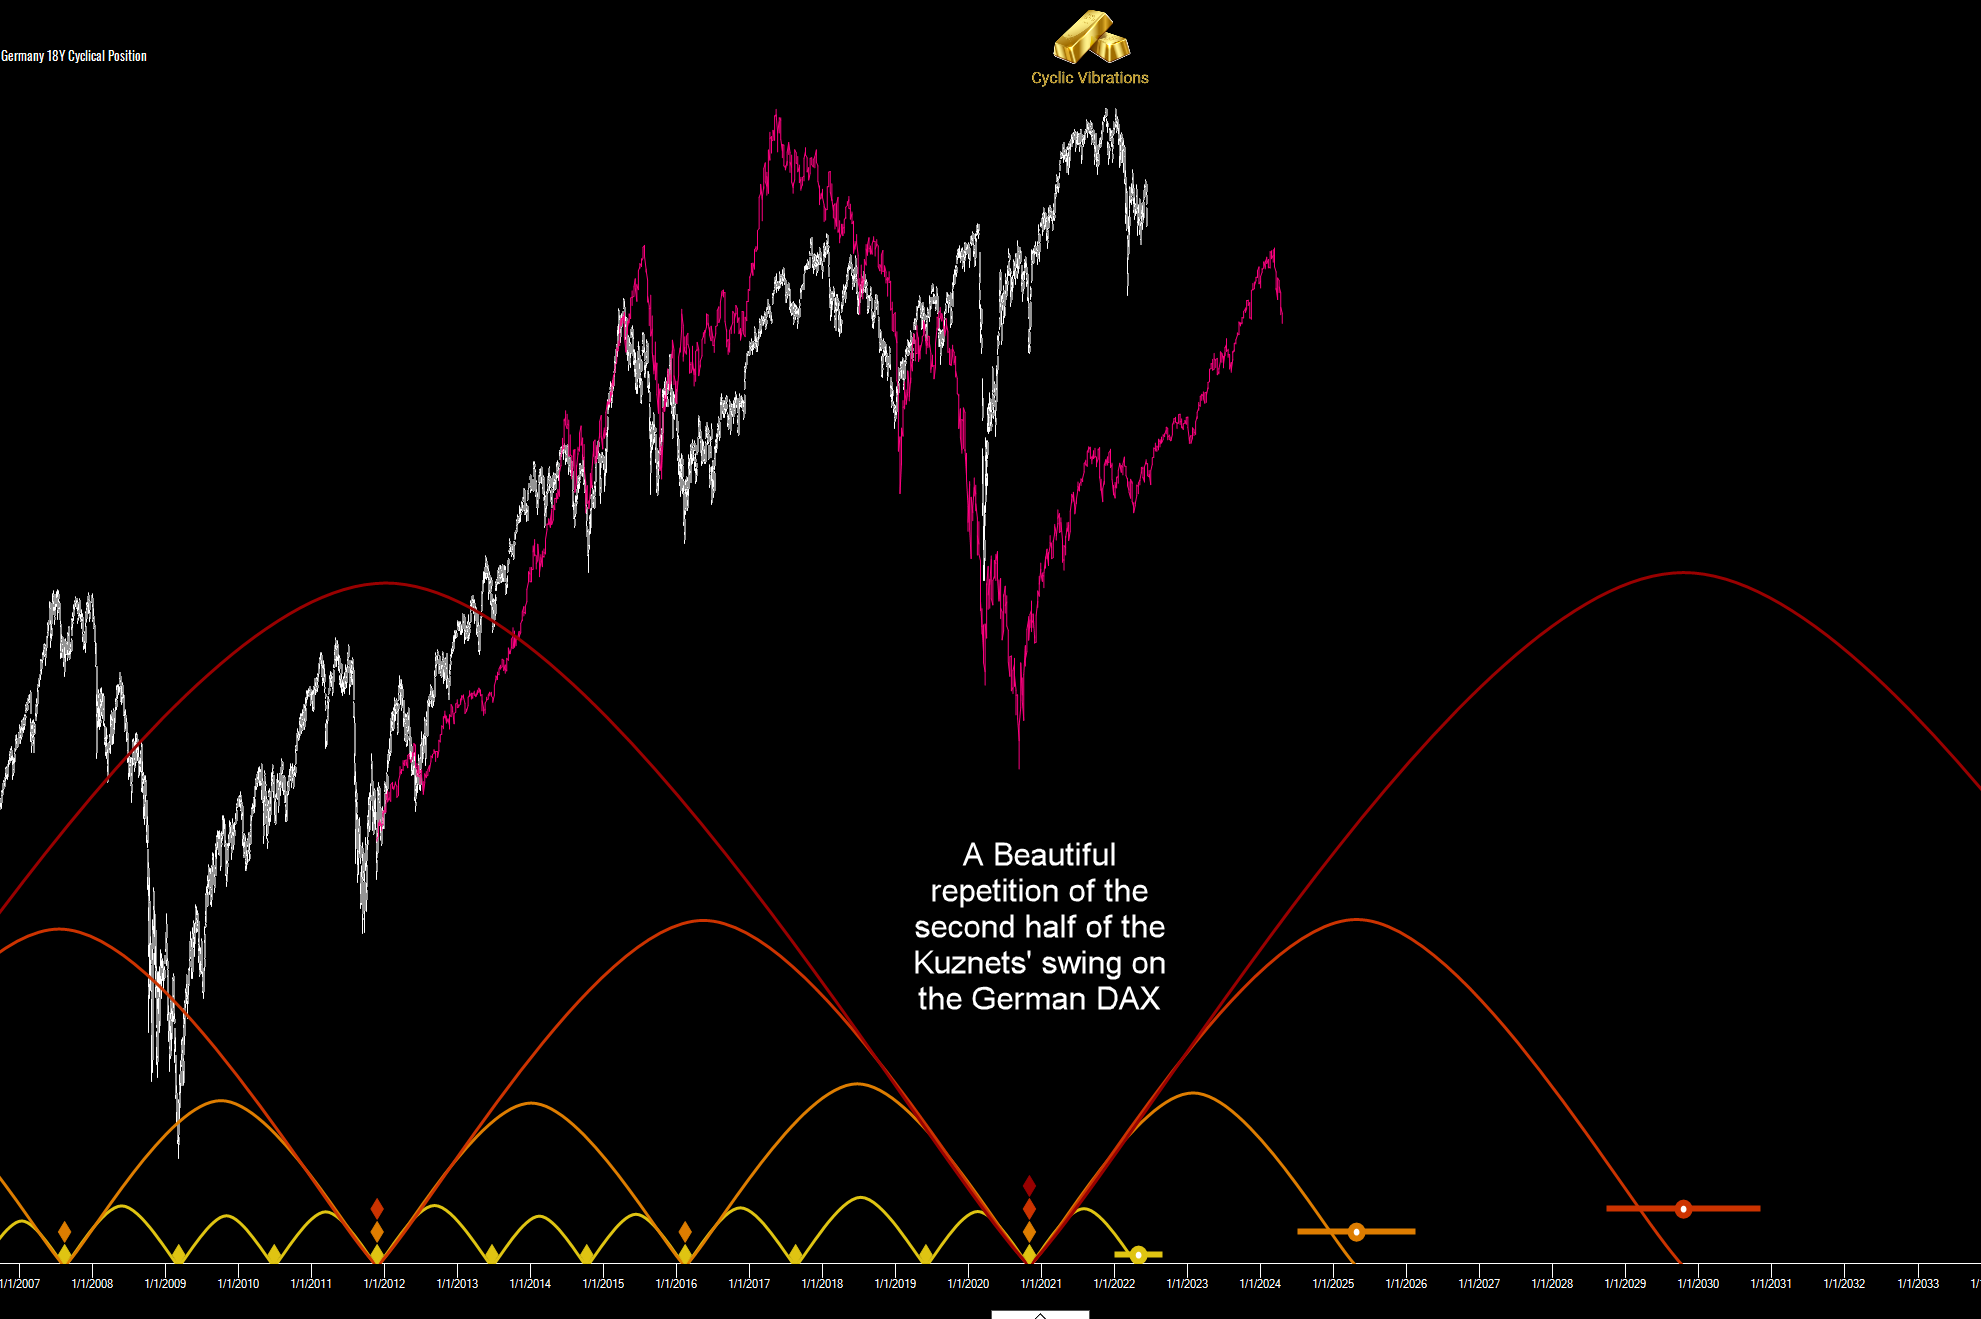
The answer to that is simple in theory yet quite complex in application. The first step is to conduct a formal phasing analysis on the financial instrument by separating the composite wave that is price into its component cycles. This is followed by locating our position within the largest cycle available to us in the price history. After finding a similar cyclical circumstance (SCC), we snap out the price history leading to our analogous position in the past and sync it with the present, utilizing a scaling factor to account for the principle of variation, to arrive at a projection for the future. The image presented on the right shows an 18-year similar cyclical circumstance on the German DAX. Notice the high correlation between the two cycles after choosing the correct starting points. If the starting point were to be altered slightly we will get a completely different and incorrect projection line for this 9-year wave. The correlation between these two periods is north of 90%. When dealing with future price data correlations of this magnitude can be achieved provided we use the correct starting point and know which cycle is going to be repeated. We have concluded, through our research, that in order to get a reliable projection of price the smallest cycle to be taken into context is the 18-year (Kuznets) rhythm. The fundamental reason for such a conclusion is the significant period of time that passed from the 18 year cyclical position to where we stand today to allow for ‘unnoticed’ behavioral correlations. The technical reason for such a conclusion is the larger similarity in trend which would naturally lead to similar trough and peak translations between the SCC and the CCC (Current Cyclical Circumstance). The rule of thumb is: The larger the cycle that is taken into consideration (the more distant it is from the present) the larger the correlation with future prices for the same reasons mentioned above.


The modified nominal cyclic model
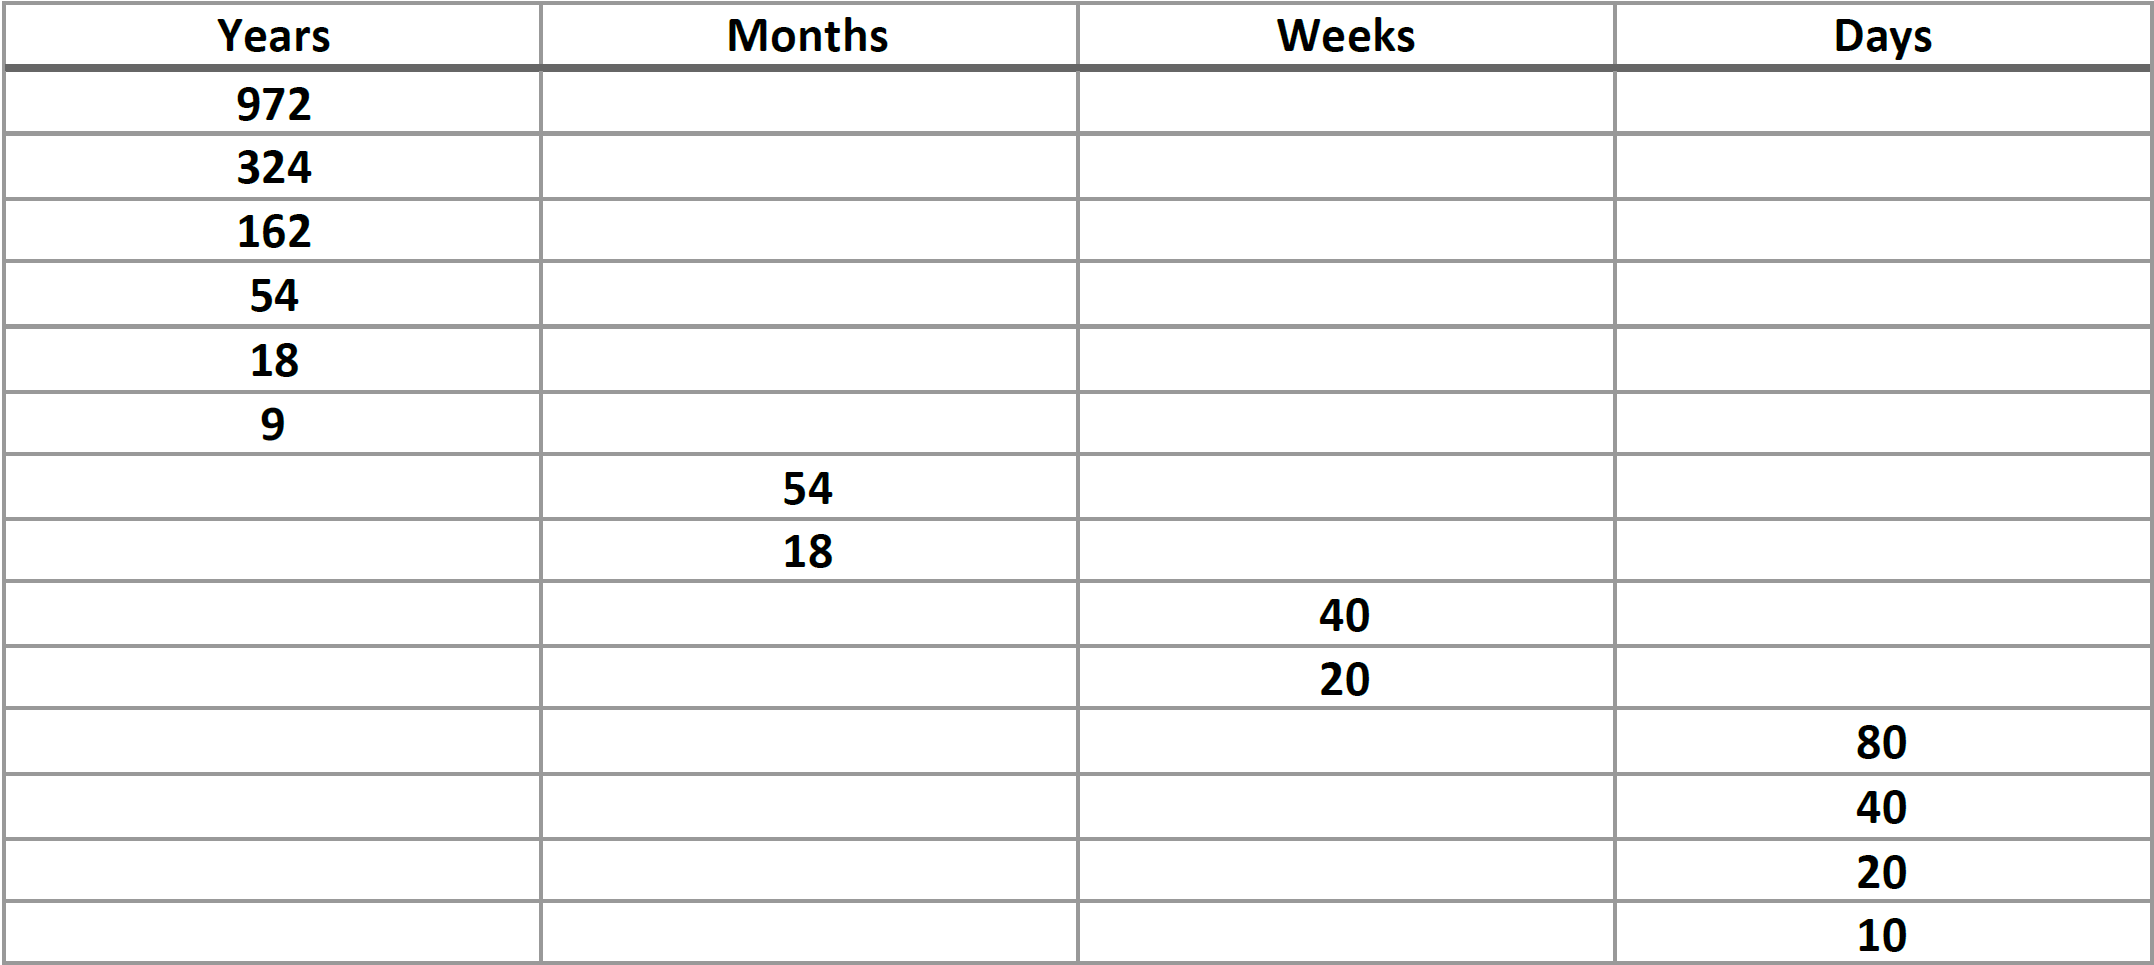
The image to the left presents our modified cyclic model. The cycles up to the 18-year wave were provided to the investment community by J.M. Hurst. We have elaborated on his findings after examining long-term historic data going back, in some cases, to the 12th century. The cycle above his 18-year wave is the infamous Kondratieff long wave followed by the hegemonic cycle of 162 years which we have come to call the Jared cycle. The two longer cycles that complete the modified cyclic model are termed the Enoch (324 years) and Methuselah waves (972 years). We were able to establish, and gain confidence in, similar cyclical circumstances for all of these multi-century waves which theoretically should be more correlated than those of smaller cycles. The correlations are staggering, to say the least! Finding similar cyclical circumstances of the 18 month, 54 month and 9 year cycles is not practical unless we are attempting to forecast a detrended indicator. For a forecast of actual prices, we only look at the 18-year rhythm and above! We would direct investors to our blog for a more detailed explanation of the financial wave theory presented in a multi-part series!
LEARN MORE