Our software’s forecast on the German DAX from May 2013 to May 2020.
In today’s article, we will present our software’s seven-year forecast for the prices of the German DAX, spanning from May 2013 to May 2020. This forecast is not a historical presentation of how our software would have performed, as we utilized part of this forecast back in 2017 to advise our clients on what was likely to occur in the German DAX when we warned our clients of a bear market that was likely to last for three years into early 2020 as presented on Figure 3 at the end of this article.
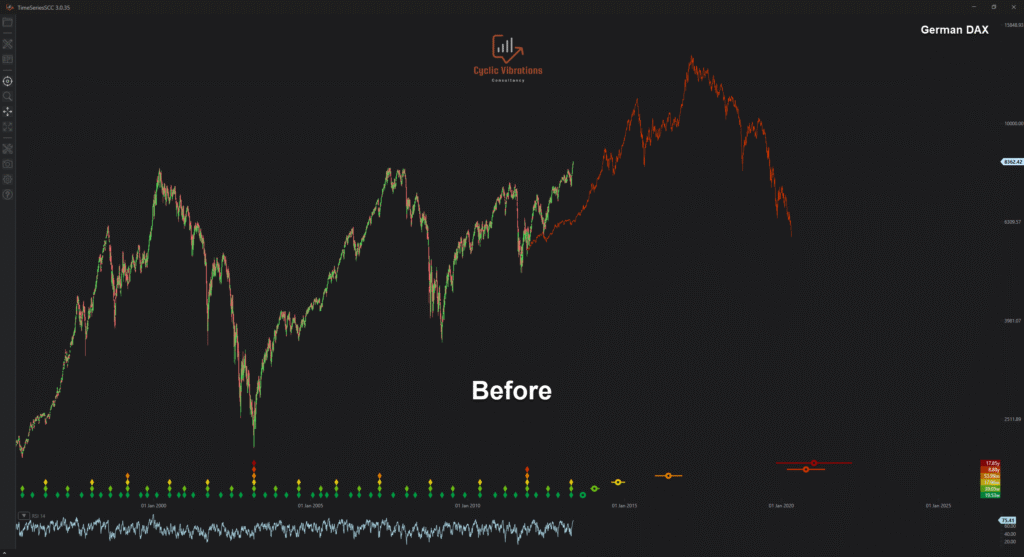
Figure 1 presents the forecast generated by our software, with some minor adjustments made by one of our analysts. By default, the software identifies the analogue and constructs the projection based on the average period of the cycle being forecasted. This method is beneficial to get a general idea of the price fluctuations within the cycle we are attempting to predict. It is essential to adjust the period of our forecast based on the minor cyclical fluctuations of the current cyclical circumstance so that they match the corresponding fluctuations in the similar cyclical circumstance. That is precisely what we did in May 2013 to yield the forecast presented in Figure 1. It is also crucial to note that sometimes, although rarely, we may need to re-adjust our prediction if the corresponding cycles fall out of sync with the similar cyclical circumstance. This was not necessary in this example; the result is presented below in Figure 2.
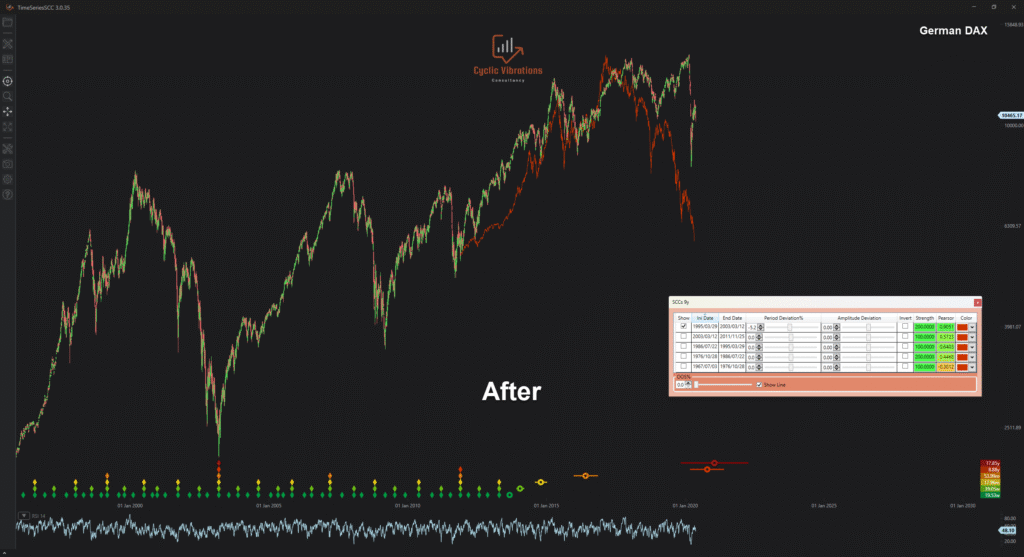
The projection yielded an out-of-sample correlation of 0.9051! This means that over 90% of the fluctuations present in the cycle we are attempting to forecast were explained by our projection. This prediction has remained valid for seven years and still appears to correlate very well with recent price data, without altering the scale used since 2013. This is yet another excellent example of the immense value added by utilising the Economic Wave Theory to make future projections for any financial instrument with sufficient historical data (~20 years) to identify analogues of large economic cycles. Presented below is evidence that CVC had been using this particular analogue since at least July of 2017.
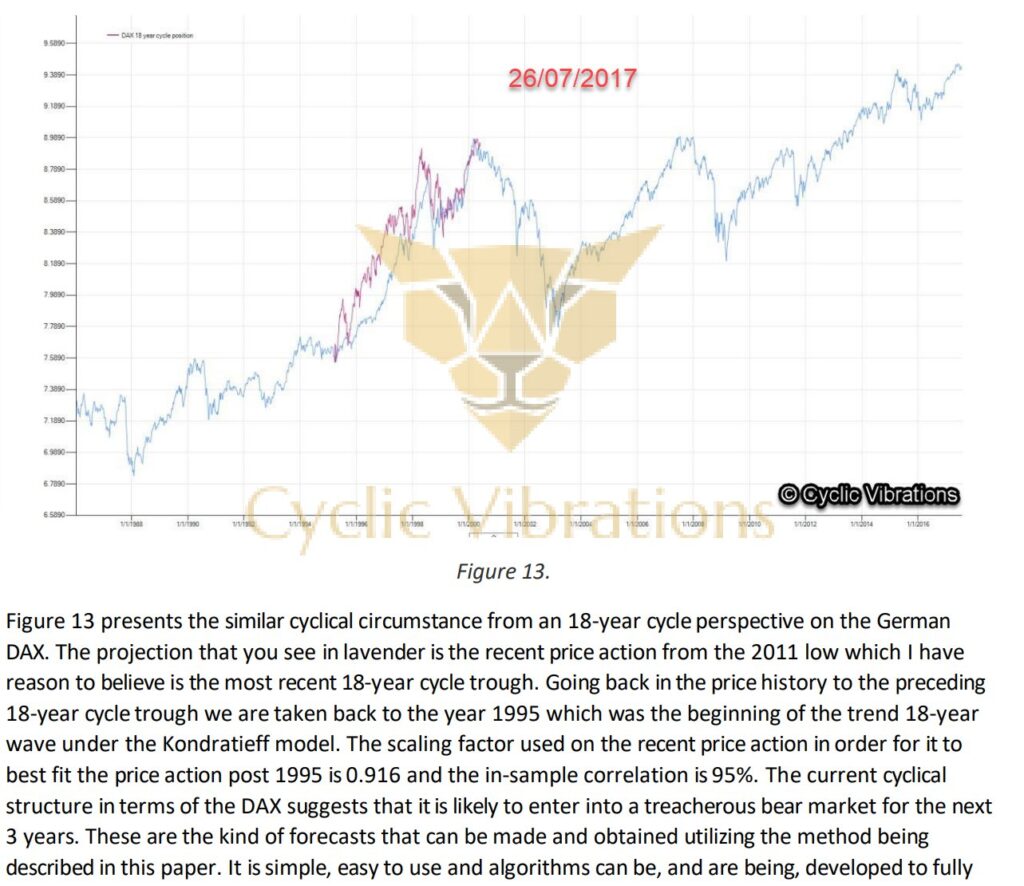
The lavender line presented on the chart is the current cyclical circumstance, and the blue line is the projection. CVC expected a bear market on the German DAX to last 3 years into 2020, which coincided with the COVID-19 pandemic low. After that, we expected a bull market that would last five years, and that is precisely what occurred following the COVID-19 pandemic low. It is essential to note that we are now at a critical juncture regarding global equity markets. If you are exposed, we would recommend that you book a consultation as soon as possible to know what the cyclical structure suggests for the future course of equities from a long-term and short-term perspective.
Thank you for your time,
CVC research team.
Recent Comments