Our software’s forecast on Tadawul All Share Index from late 2011 to early 2016.
Our proprietary methodology can be successfully applied to any market with sufficient historical data to utilise a similar economic circumstance, such as that of a significant economic wave. In today’s article, we will view another example of this theory’s application on a foreign stock market — The Tadawul All Share Index of Saudi Arabia from late 2011 to early 2016. We have conducted a Formal Phasing Analysis (FPA) on this stock index from 1985 to 2011 to discern which portion of the past data will have a high correlation with the future. Figure 1 presents a similar economic circumstance that we chose to use to forecast future prices into early 2016.

As visible above, the forecast the software has generated for the Saudi stock market suggested that we were likely to embark on a multi-year advance followed by a swift corrective movement to form a significant cyclical trough. The projection also alerts us that this advance is to occur in two steps: a short advance, followed by a sideways consolidation, then an accelerated advance higher into August-November 2014. Once the peak is realised, we can expect a swift sell-off in three waves into January of 2016 before any renewed optimism on this market index. Let us now examine what happened from January 2012 to January 2016.
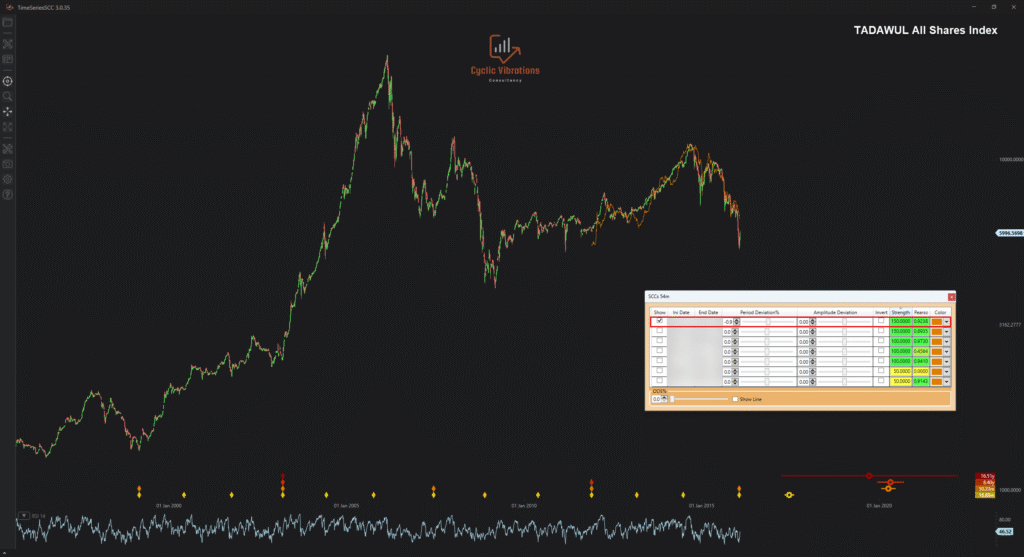
As visible in Figure 2, the advance took place in two steps, the first was short and was followed by a sideways consolidation, as our forecast predicted. The consolidation was followed by an accelerated advance into a peak that occurred in September of 2014, which falls within the range indicated by our projections. The ultimate high was followed by a corrective dip that took the shape of a three-wave sell-off that bottomed in January of 2016, precisely as our forecast suggested. The overall correlation of the similar economic circumstance and the current economic circumstance is 0.9238. This means that our forecast explained over 92% of the price fluctuations that occurred from January 2012 to January 2016, something that you will only find here at Cyclic Vibrations Consultancy (CVC). It is essential to note that our methodology performs optimally when applied to indices (such as stocks, commodities, or currencies) rather than individual issues. The reasons for that will be tackled in great detail in a future article. This does not mean that individual issues don’t exhibit cyclic behaviour, because they do. The overall correlation of the analogue with the current and future environment is usually lower than that obtained for indices. Relying on data received from the FPA proves more useful than relying on price fluctuation forecasts from analogues. The Tadawul All Share Index continued to correlate well with historical analogues after 2016, which may be a topic for a future article. We will continue to present prospective clients with more examples of successful application of the Economic Wave Theory so that when you do book a consultation, you are entirely convinced of the power of this unique methodology!
Thank you for your time,
CVC research team.
Recent Comments