Understanding Commodity Prices: War Indicators and Future Projections (The Economic Wave Theory and Hurst Cycles)
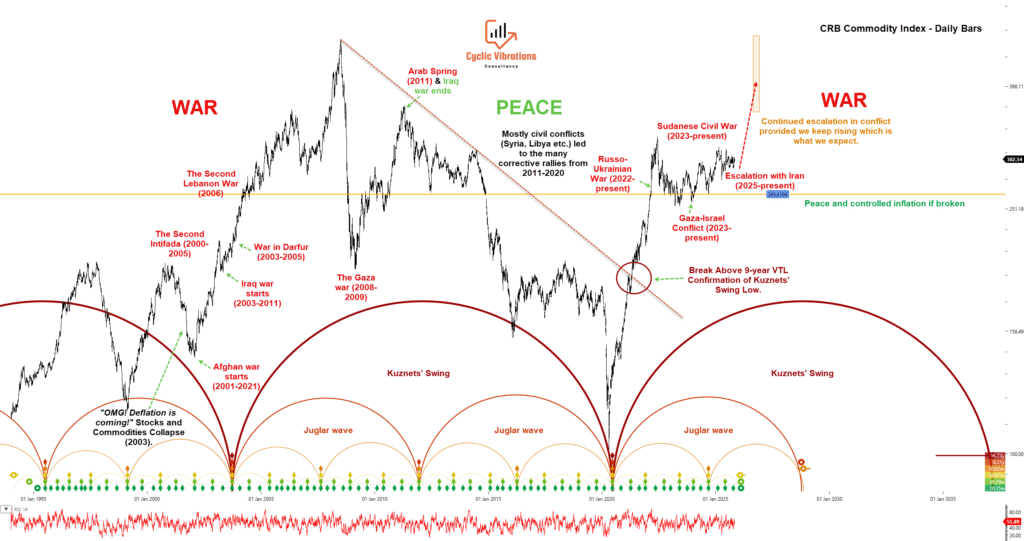
Figure 1
This analysis establishes a hypothesized positive correlation between the swings in the WAR (first half) and PEACE (second half) cycles and commodity price cycles.
Commodity Price Projection and Conflict Indicator
A significant upside movement in commodity prices is projected for 2026. This forecast can be interpreted as a leading indicator of increased global warfare and conflict that should coincide with the price rise.
Cyclical Timing and Peak Divergence
The 18-year analogue suggests this rally will constitute a 26-month upswing. However, positioning within the longer-term Kondratieff cycle indicates that a market peak is more probable in 2027, given that the peak of the current 54-month cycle occurred in the second 18-month wave of the corresponding 54-month cycle in the analogue. This deviates from the 2028 peak timing suggested by the 18-year analogue.
Key Takeaways
- Cyclical Model: The chart uses long-term Kuznets’ Swing (18-year) and medium-term Juglar Waves (9-year) and below to map the commodity price movement since the early 2000s.
- War Drives Prices: Major price surges (bull markets) are labeled “WAR” (red), correlating with conflicts like the Iraq War, the Second Lebanon War, the Russo-Ukrainian War, and the Gaza-Israel Conflict.
- Peace Brings Decline: A long decline in prices is labeled “PEACE” (green), corresponding to the relative stability and post-conflict period from 2011 to 2020.
- Current Forecast (2020-Present): The chart shows a major price break above a multi-year trendline (VTL), suggesting that continued conflict escalation is expected to drive commodity prices higher.
- Controlling Idea: The analysis is based on the premise that global conflict is the primary factor driving major bull markets in commodities.
Note:
When the peak of the current cycle of the Juglar wave is confirmed, we can expect a pullback in geopolitical tensions as well as the formation of a trough along with price in early 2029. Details are in the chart in Figure 1.
Ahmed Farghaly
Founder & CEO of Cyclic Vibrations Consultancy
The Kuznets’ swing is a building block of larger waves of conflict as presented above.
Recent Comments