Understanding Economic Wave Theory and Market Cycles
The Principle of Commonality and Economic Wave Analysis
Previous work posited a singular governing source for human affairs. While this principle of commonality serves as a foundational force, national and corporate fundamentals introduce market variation. Consequently, each economic instrument exhibits a similar yet unique current cyclic model.
The Economic Wave Theory (an elaboration of Hurst cycles) provides a robust framework for accurately predicting the global macro-economic environment. By establishing the expected macro-environment, analysts can then determine the historical impact on various economies. This allows for a projection of analogous outcomes, contingent upon supportive national fundamentals, that should make a similar outcome to the historical analogy, the likelier outcome.
We now turn to the application of Economic Wave Theory to inflation-adjusted (real) charts. These charts are often preferred for phasing analysis, as inflation can obscure the troughs of smaller waves, complicating identification.
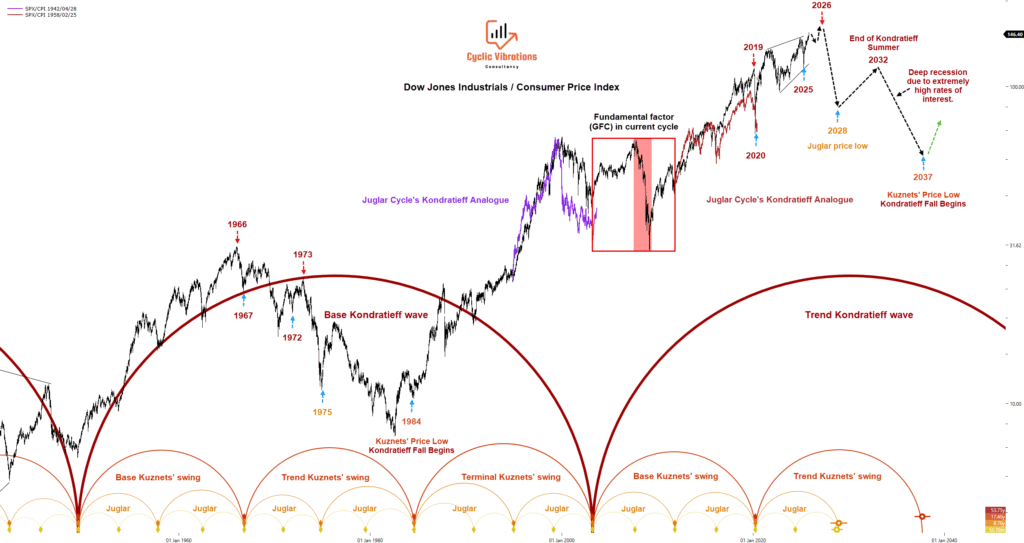
Figure 1
📈 Cyclical Analysis of the Inflation-Adjusted Dow Jones Industrial Average
This analysis utilizes the Economic Wave Theory (incorporating Kondratieff Waves and Kuznets’ Swings) applied to the inflation-adjusted Dow Jones Industrial Average (DJIA), tracking the Hegemony wave from its last known trough in 1949.
Kondratieff Wave Phasing and Market Characteristics
| Phase | Time Period | Key Economic Characteristics | Equity Market Impact | Cyclical Position |
| Spring | 1949–1966 | Strong economic growth with low inflation. | Significant real-term appreciation for equity owners. | First Kuznets’ swing. |
| Summer | 1966–1982/84 | High inflation and stagflation. | Real-term pressure and decline due to rapid CPI increase. | Second Kuznets’ swing (often mistaken for the main Kondratieff correction). |
| Fall (Autumn) | 1982/84–1999/2000 | Characterized by asset bubbles (e.g., 1980s and 1990s). | Period of nominal and real capital expansion leading to a peak. | Third Kuznets’ swing’s up-phase |
| Winter | 1999/2000–2003 | Cyclical decline and recession. | Significant real-term correction and trough. | Third Kuznets’ swing’s down-phase |
Table 1
Methodological Note on Inflation-Adjusted Charts
Analysts must exercise caution with inflation-adjusted charts during the Kondratieff Summer (high-inflation period). The strong decline in real equity values due to inflation pressure can be misidentified as the overall Kondratieff wave correction, rather than the expected correction of the second Kuznets swing. Consequently, all significant economic wave troughs mandate confirmation by the principle of commonality to mitigate misinterpretation arising from the data construction method.
Forecasting and Predictive Power
The presented chart effectively integrates this cyclical analysis with back-tested historical analogues and a time/price forecast. The two projections (e.g., the lavender and crimson lines representing analogous Juglar cycles) demonstrate the model’s high predictive power. Specifically, the analogue of the 1995-2003 Juglar cycle accurately forecasted the market peak at the end of the Fall season, the subsequent Winter decline, and the eventual trough. All projections were adjusted for the principle of variation, in cycle period, and amplitude before being displayed on the chart.
🔮 Projected Economic Wave Turning Points (2026–2037)
Based on the historical analogue and cyclical analysis derived from the Economic Wave Theory, the following turning points are projected for the coming decades:
| Cycle Component | Expected Event | Projected Timing | Significance |
| Juglar Wave | Peak | 2026 | Projected high point of the current medium-term Juglar economic wave cycle. |
| Juglar Wave | Trough | 2028–2029 | Projected end of the current medium-term Juglar economic wave cycle. |
| Kuznets’ Swing | Peak | 2032 (in commodities) | Projected high point of the current long-term Kuznets’ swing cycle. |
| Kuznets’ Swing | Trough | 2037 | Projected end of the current long-term Kuznets’ swing cycle. |
Table 2
These projections represent the key expected turning points in the economic cycle, derived from the observed correlation with the historical analogue. The following image presents an almost identical technical and cyclical picture on the German DAX.
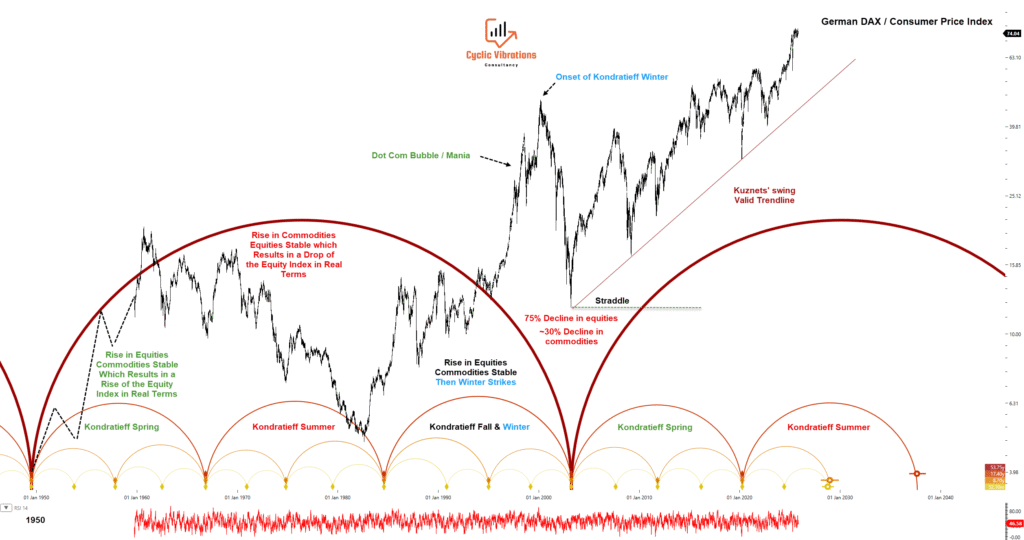
Figure 2 (Demonstrating the Principle of Commonality)
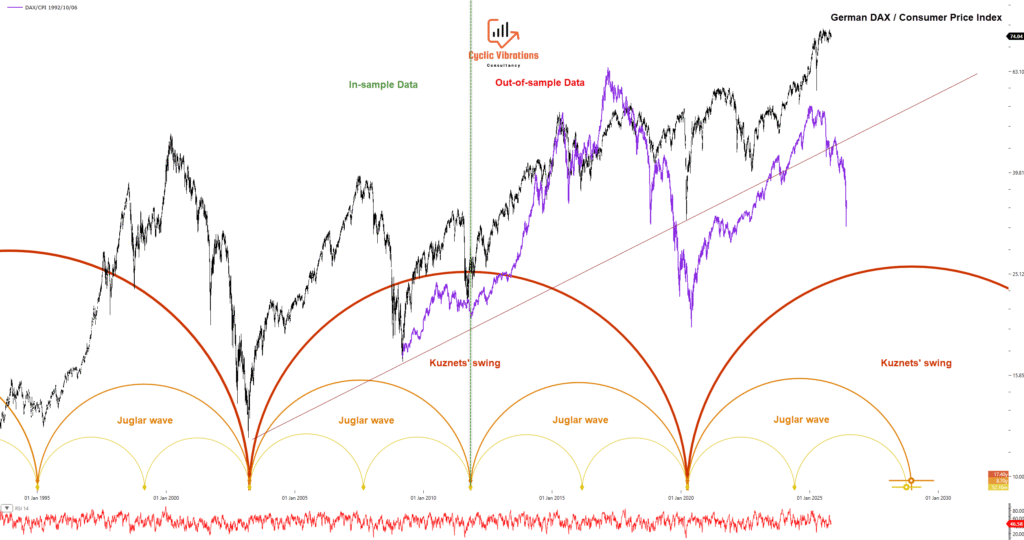
Figure 3 (Economic Wave Theory back-test on German DAX)
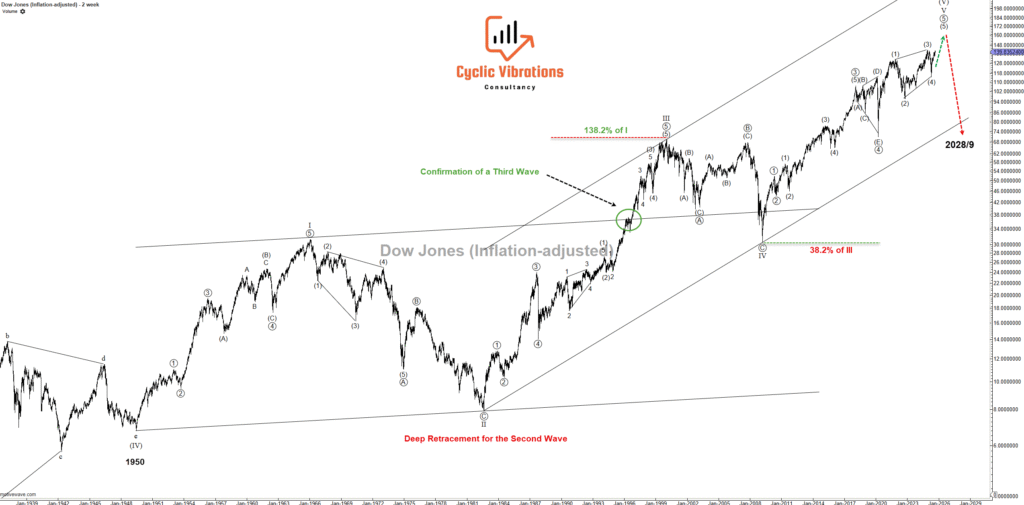
Figure 4 (Preferred Elliott Wave Count on DJI adjusted for inflation)
📉 Synthesizing Elliott Wave and Economic Wave Theory for Cyclical Peak Prediction
The Elliott Wave (EW) structure on the inflation-adjusted Dow Jones Industrial Average (DJIA) strongly suggests an imminent long-term market peak.
Our analysis, informed by extensive study since 2008, emphasizes that relying solely on the EW Principle can be detrimental due to the multiplicity of valid counts (interpretations often validated post hoc). Integration with the Economic Wave Theory (EWT) is crucial, as it provides a robust framework for filtering and ranking EW counts based on probabilistic alignment with larger economic cycles.
The structure illustrated (Figure 4) is considered textbook and ideal, supporting the terminal phase of the major EW leg that commenced in 1949 (a cycle lasting over 76 years).
Evidence Supporting an Imminent Crash
A convergence of analytical methods confirms the high probability of a severe correction:
- Kondratieff Analogue Guidance: Provides the macro-cyclical timing context.
- Preferred Elliott Wave Count: The most probable EW interpretation predicts a potential price peak occurring soon.
- Classical Rising Wedge Pattern: A recognized technical reversal formation.
This confluence strongly suggests a crash is imminent, serving to terminate the up-phase of the current cycle of the Juglar economic wave.
Future Outlook
The probability of achieving new highs during the subsequent second cycle of the Juglar wave (2028–2037) remains an open question. Determining whether the market will reach a new high or merely a lower high (~2032) before the final secular sell-off into 2037 requires further data collection and ongoing evidential analysis.
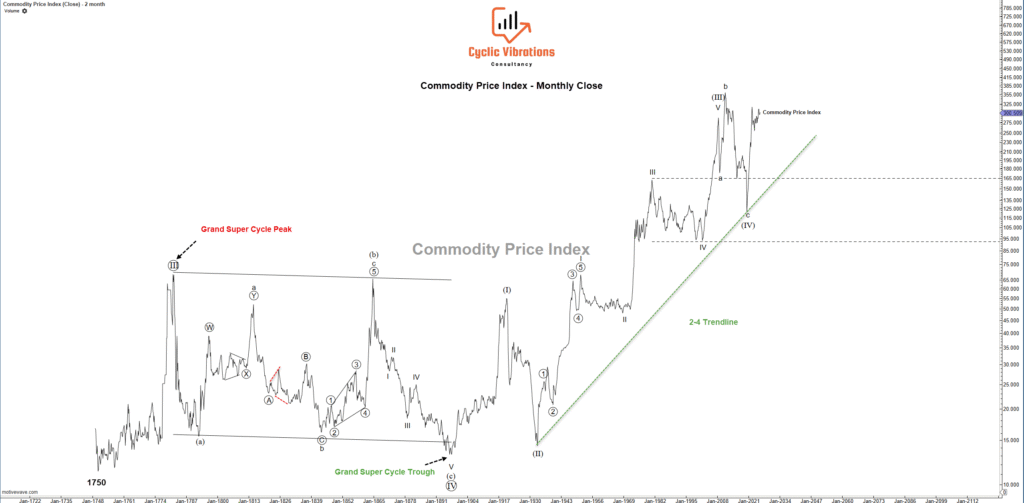
Figure 5 (Preferred Elliott Wave Count on Commodity Price Index)
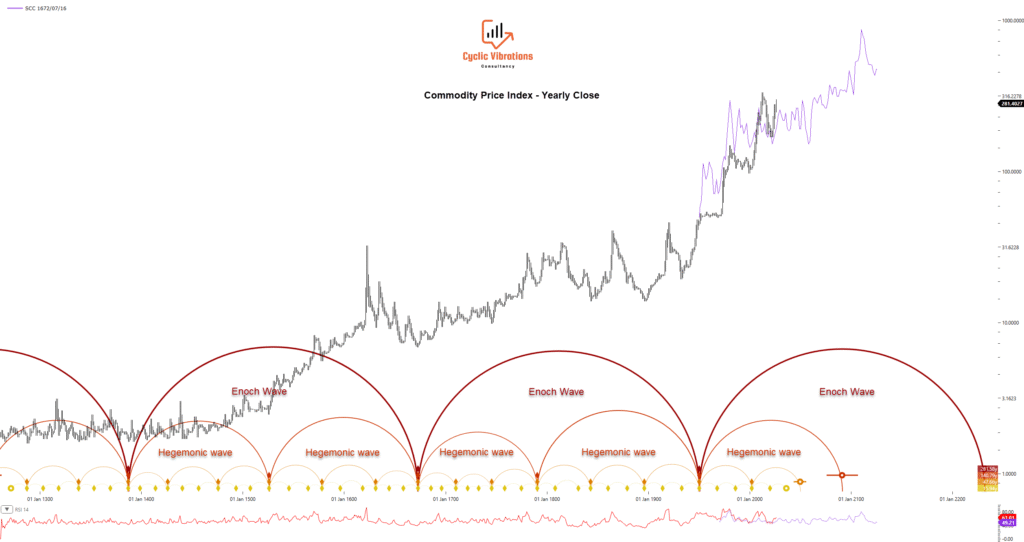
Figure 6
The presented figure illustrates the cyclical analysis of a commodity price index dating back to 1259 AD. Based on the Principle of Commonality, the phase demonstrated by this index is highly analogous to the phase of all economies worldwide.
The dominant cyclical structure, identified as the Enoch cycle, suggests that the current global economic phase corresponds to the year 1723/24 within this long-term cycle.
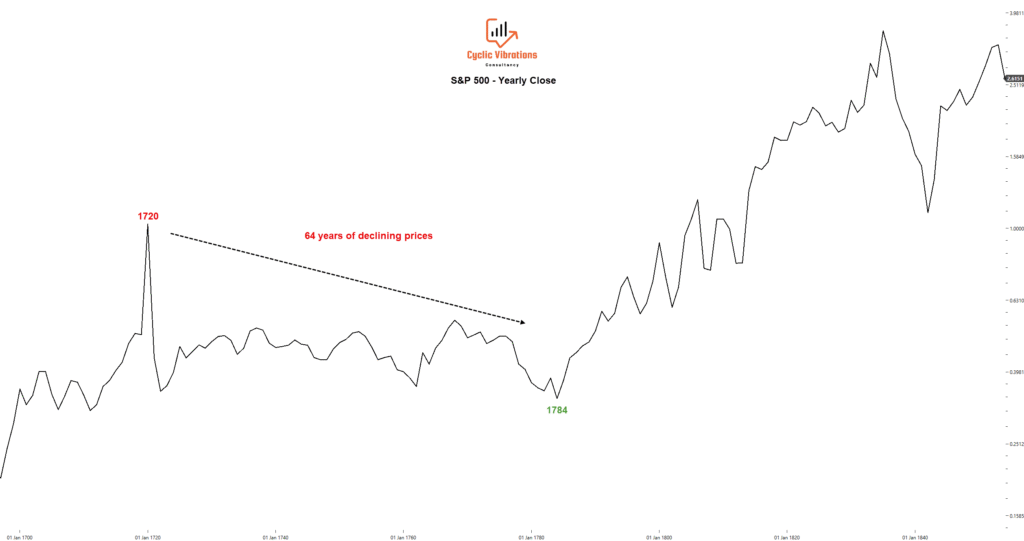
Figure 7
🧭 Enoch Cycle Projections for US and European Equities
Based on the Enoch cycle analog derived from the long-term commodity price index, the projection for US and European equity markets is a sideways to downward trend.
Key Considerations
Principle of Variation: Analysts must remain cognizant of the potential variation from the principle of commonality that could exist between the annual commodity chart (the basis for the Enoch cycle analogue) and equity market performance. Differences in national fundamentals (as well as the three unpredictable fundamental factors) could temper or skew the analog’s predictive power for that particular economy. It is critical to note that any fundamentally driven deviation in cycle period is corrected, given that synchronicity in global markets is the rule rather than the exception.
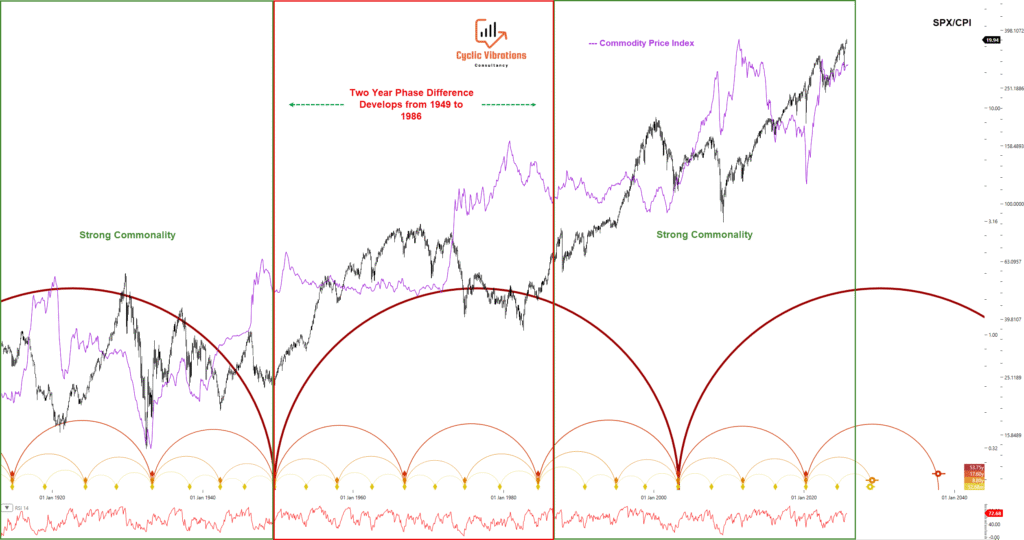
Figure 8
Peak Translation: It is critical to note that the current Enoch cycle is translating to the right relative to the analog (Provided there does not exist a phase difference). This suggests the up-trend in the present cyclical circumstance exhibits greater strength or duration than its historical counterpart, given the difference in the direction of action of larger economic and social waves between the compared periods.
Conclusion
This analysis validates the application of Hurst’s Cycles Principles (Economic Wave Theory, EWT) to inflation-adjusted financial instruments as a superior framework for long-term cyclical forecasting, particularly when utilized to resolve the inherent ambiguity of the Elliott Wave Principle. The synthesis of EWT and EW applied to the inflation-adjusted Dow Jones Industrial Average (DJIA) reveals a high-probability consensus: the 76-year major EW leg, which initiated in 1949, is in its terminal phase.
The convergence of our cyclical interpretation, the preferred EW count’s structure, and the presence of a Classical Rising Wedge pattern collectively indicate an imminent, severe market correction designed to terminate the up-phase of the current Juglar economic wave cycle. This finding is further contextualized by precise cyclical forecasts: a Juglar wave peak in 2026 preceding a trough in 2028/2029, followed by a Kuznets’ peak in commodities in 2032 and a secular low projected for 2037 in commodities and equities.
Furthermore, the long-term Enoch cycle analog from the commodity price index suggests a prolonged sideways-to-down trend for US and European equities from a macro perspective. While the current cycle exhibits more rightward translation (stronger up-trend), analysts must perpetually account for the Principle of Variation between the commodity and equity markets. Nevertheless, the predictive strength demonstrated by the back-tested analogues (Figure 1 and Figure 3) reinforces the robustness of the EWT methodology in anticipating major cyclical turning points across global markets.
Ahmed Farghaly
Founder & CEO of Cyclic Vibrations Consultancy
Recent Comments