Our software’s forecast on the Dow Jones Industrial Average since the COVID-19 low to date.
The Economic Wave Theory suggests that future price movements should be similar to past price movements if the economic environment is similar. We utilise economic waves to anticipate the future economic environment with very high accuracy. Once one determines the future economic climate, all one has to do is look for a similar economic environment based on the Economic Wave Theory and utilise what happened in a similar climate to forecast what will happen in the future. Today we will present an application example of the Economic Wave Theory by illustrating our expectations since the COVID-19 pandemic low on the Dow Jones Industrial Average.

This forecast on Figure 1 was calculated on May 25th 2020, with the hope of explaining the future fluctuations of the Dow Jones Industrial Average. The rationale behind this forecast is what we term Similar Economic Circumstances, also referred to as SEC. It is interesting to note that forming such projections only works when utilising a large economic cycle rather than a small, short-term trading cycle. We have isolated the composite wave, that is price, into its constituent cycles by conducting a Formal Phasing Analysis (FPA) on the historical data. Once we know where we are in an economic cycle, we look at what we term analogues (similar positions in prior cycles) to construct projections like the one you see on the price chart. It is essential to note that several economic cycles are known to us so far. This means that we can arrive at several analogues, all of which will affect future price movements. The larger the period of the economic cycle, the higher the correlation with future prices, considering that it is too distant in the past for people to remember, which leads to repetition of prior mistakes that yield a higher technical correlation, as mentioned. Lessons learnt in short-term cycles are still present in society’s memory, which prevents them from repeating historical mistakes. This yields a lower technical correlation, which is why short-term cycles are seldom used in the construction of forecasts. The technical reason for higher correlations of large cycles is the higher similarity in trend. The similarity in trend leads to similar cyclical positions of peaks and troughs within the forecast, yielding a high technical correlation. Let us examine how well our forecast worked in depicting future price movements.
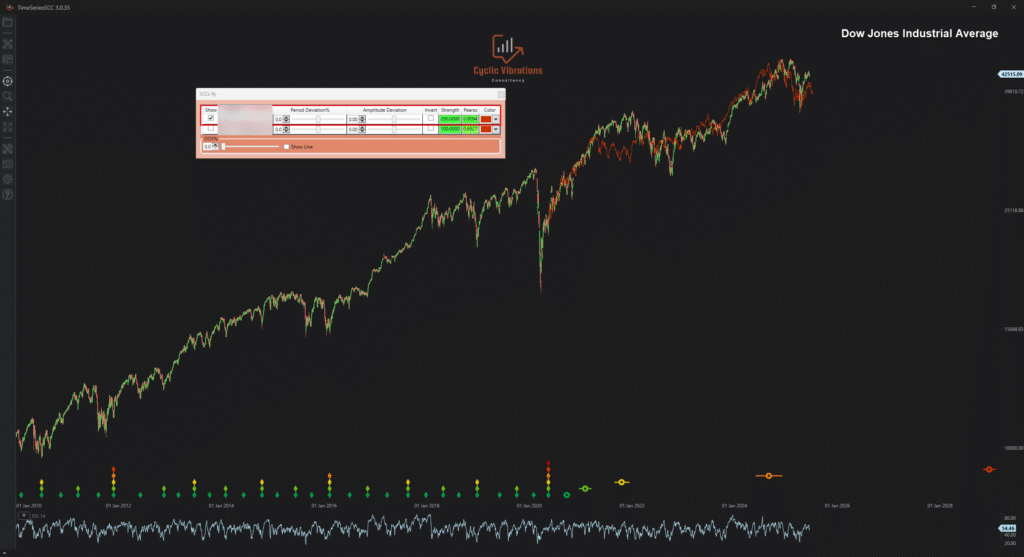
Figure 2 presents the forecast presented in Figure 1 along with an updated price record (last bar June 16th 2025). This forecast, based on a similar economic environment, is invaluable and would have greatly assisted investors and traders in navigating the current economic climate. The correlation coefficient of the SEC (similar economic circumstance) and CEC (current economic circumstance) is 0.9094 as presented in the Figure! This means that our forecast explained almost 91% of the price movement that occurred after May 25th 2020, to date. Most of our projections exhibit similar correlation coefficients when the CEC and SEC are free from major fundamental factors. If it weren’t for the Russia-Ukraine war that caused the decline in 2022, our forecast may have explained 95% of the price movement. The FPA needs to be very precise to obtain such high out-of-sample correlations, and that is what we do best here at CVC. If the FPA is inaccurate, you will have flawed expectations of the future economic climate, and you may use inaccurate analogues that will yield low or negative out-of-sample correlations. This forecast continues past the current date, which you will be able to view upon a consultation regarding this instrument. We hope this article convinced you of the value CVC can add to your team when it comes to accurate forecasts based on economic cycles. We can construct forecasts, as the one presented above, for the most popular instruments, provided we have sufficient historical data to identify accurate analogues of larger economic waves and determine the correct base or starting point. We will continue to present historical forecasts made by our team in future articles on our website.
We hope you found this article interesting.
CVC research team.